The City of Sarnia is inviting residents to provide feedback through its newly launched Sarnia Transit Rider Survey, which seeks to gather insights into how the local public transit system can be improved based on the needs and experiences of its users.
In The Transit Ridership Recipe, transit consultant Jarrett Walker outlines strategies for boosting ridership, highlighting the challenge of balancing high ridership with broad coverage, known as the Ridership-Coverage Tradeoff. He also stresses the crucial role of bus frequency in effective transit. This article examines these factors in the context of Sarnia’s transit network.
Walker advocates that to maintain high ridership over long hours, a transit authority should deploy its most effective—though costly—tools, like high frequency and long duration, in areas where they will succeed.
He identifies three key criteria: a large potential customer base, easy access to the service, and reasonable service costs relative to ridership. The result is a high-ridership route with multiple vehicles running frequently.
The cost of providing transit service depends on the number of buses running along a route.
The cost of transit service depends on the number of buses and route factors:
-
Add frequency: Doubling the buses doubles the cost per kilometer. (e.g., from 30 to 15 minutes between arrivals)
-
Add distance: Doubling the route length doubles the cost.
-
Speed it up: Doubling the speed halves the time buses take to complete the route, requiring only half as many buses and reducing the cost by half.
Walker emphasizes that when we hold frequency and speed constant for high-ridership transit, the key question is, “How far must we go to reach enough people?” This is similar to asking, “How much will it cost to attract enough customers?” when starting a business.
In transit, the answer depends on the development pattern, particularly four key measurable factors: Density, walkability, linearity, and proximity. This article covers the first two.
Density
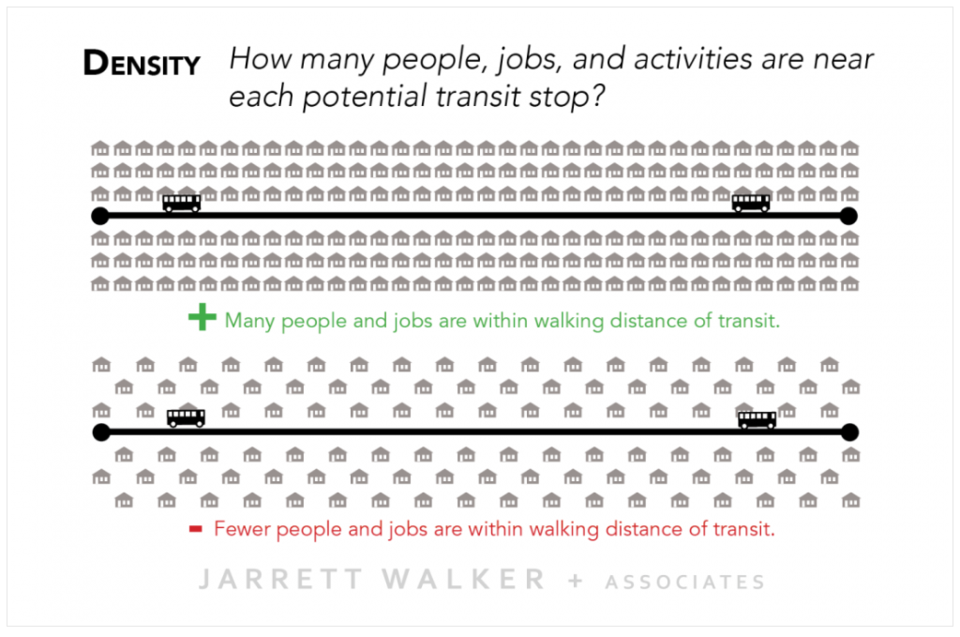
The image below compares two towns with identical transit lines and costs. The first town has double the population density, meaning ridership would be twice as high if everyone used transit equally. With the same costs, the first town offers a 2x better investment, as higher density makes the service more accessible to more people, attracting more riders.

Walker argues that density can impact transit ridership more than population size. In higher-density areas, parking is more expensive or scarce, and amenities are closer, making people more likely to walk or cycle. Additionally, those without cars are drawn to these areas for better transit access. This can lead to increased ridership in dense areas.
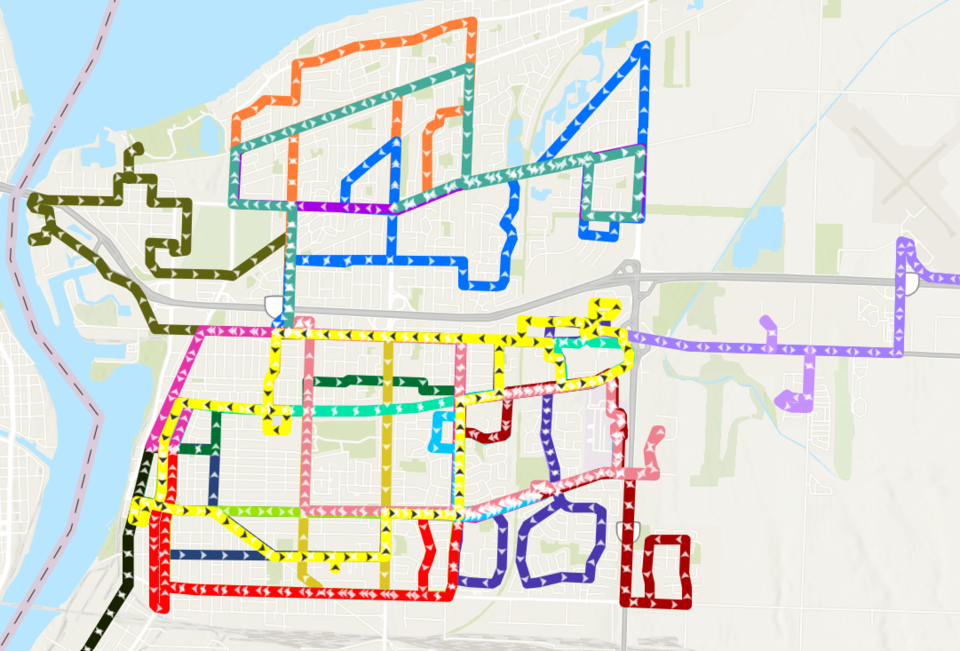
Sarnia’s population is primarily concentrated south of Exmouth St. and west of East St., with key destinations in Downtown, Mitton Village, Northgate and the Waterfront. These areas are directly connected to the southeast, which also features higher density residential and mixed-use areas with important destinations like Smart Centres, Lambton Mall, and Lambton College.
Focusing on increasing transit frequency along East-West corridors in south-central Sarnia offers strong potential for high ridership and future transit-oriented development. Similarly, establishing North-South connections along Christina St., Mitton St., East St., Indian Rd., and the Quinn Drive/Lambton Mall Rd./Finch Drive corridor would provide crucial links for people and places.
Walkability
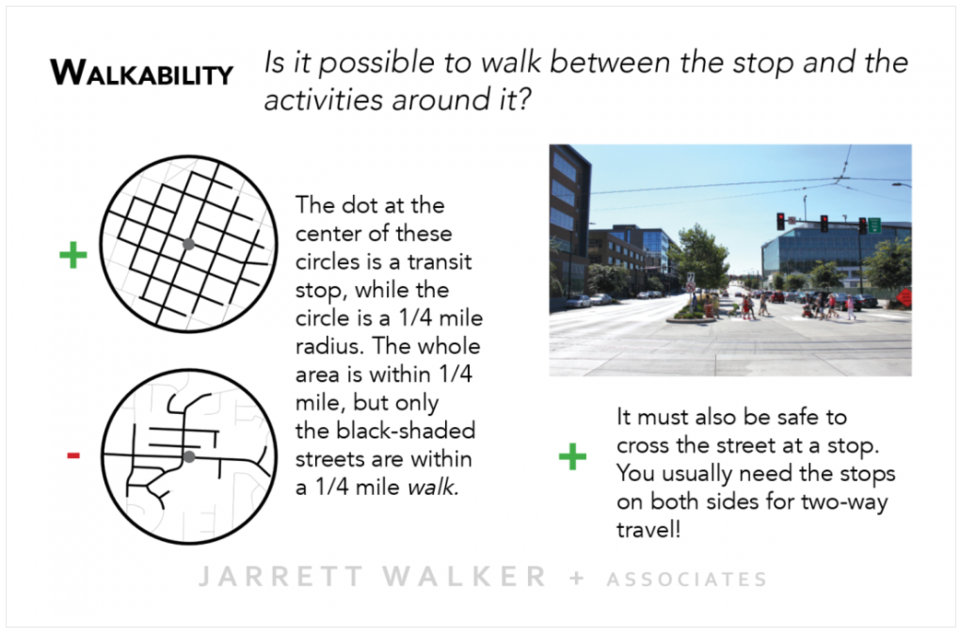
The local street network and design are crucial in access to transit stops and ridership. In the image below, the circles represent a 400m radius around a bus stop (grey dot), with gray lines showing streets within a 400m walk. A gridded street pattern provides much better access, while a disconnected suburban layout limits it. As a result, neighbourhoods with better walkability have greater ridership potential. When transit stops are located on opposite sides of a major road, safe pedestrian crossings are crucial for round-trip riders. Unsafe crossings can deter ridership and result in reduced service in those areas.

Sarnia’s more walkable neighbourhoods are located in the city’s southwest and southeast. The southwest features a grid street pattern with sidewalks on both sides. While the southeast features a mix of higher density housing in mixed-use areas. These designs keep several destinations within a walkable or bikeable distance (despite limited biking infrastructure). In contrast, the newer developments in the northeast are less walkable, with limited pedestrian infrastructure, wide roads, and a disconnected suburban layout that distances people from key places.
This is not a reflection of personal preferences regarding home or neighborhood design. www.walkscore.com provides walkability scores for various locations across North America. Mitton Street South and The Addison, a new apartment complex on Afton Court, have a Walk Score of 70/100, which means they are considered "very walkable," with most errands achievable on foot. In comparison, The Rapids Parkway has a Walk Score of 20/100, indicating that nearly all errands require a car.
Based on Walker's suggestions, Sarnia’s highest ridership potential is found in its most walkable areas in the southwest and southeast, which also offer the greatest combination of housing density and destinations.
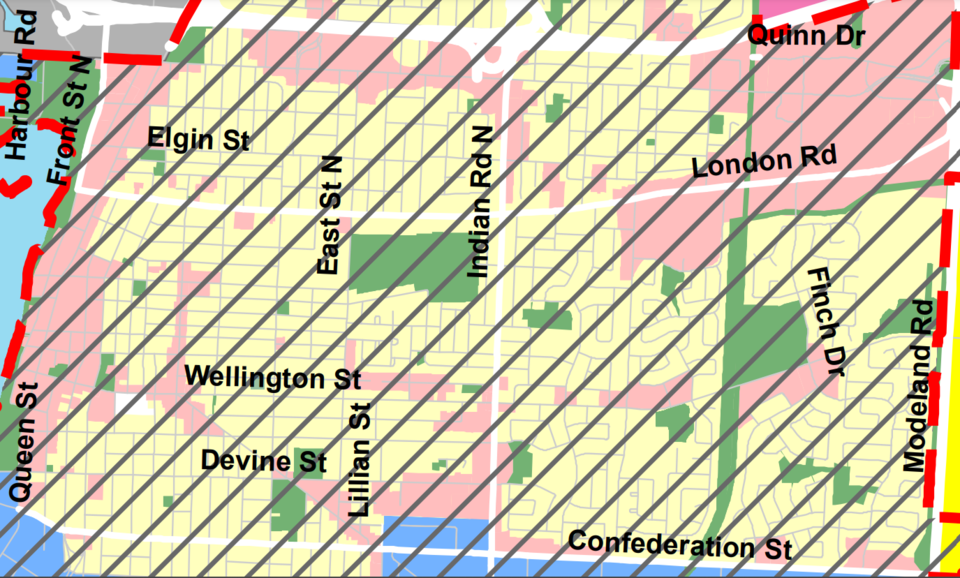
This aligns with the City’s Official Plan for intensification in Strategic Growth Areas including Mitton Village, Downtown, Northgate, and the Quinn Drive/Lambton Mall/Lambton College areas. It also emphasizes strategic growth along key corridors such as Exmouth St., Indian Rd (south of 402), Wellington St., Devine St., and Confederation St.

Sarnia's Official Plan aims for at least 45% of all new residential development to be located within the city's Built-Up Area. The plan’s Strategic Growth Areas align closely with Sarnia's densest and most walkable areas, linking the city’s growth strategy with the potential for high ridership transit. Strategic investments in these areas could significantly transform Sarnia Transit.
How to Share Your Thoughts:
-
The Sarnia Transit Rider Survey is open until 4 p.m. on December 20, and residents are encouraged to participate to help shape the future of the city’s transit system.
